VELOCITY_FORECAST
VELOCITY_FORECAST(FIRST([Count Of Records]), 0, 5)Syntax
VELOCITY_FORECAST(start point, goal value, velocity per day)
Shows the forecast line from specified start point based on custom velocity.
start point: FIRST/LAST aggregation that specifies a point on the chart to start forecast from.
goal value: Aggregation or number which set end of forecast.
velocity per day: A number greater than 0 which shows daily velocity.
Use cases
Velocity Forecast
Shows the forecast when all work will be done based on custom velocity (1 task per day).
Source: History
History records related to production flow of implementing super hero protective suite feature
| Start Date | End Date | Status |
|---|---|---|
| 03 Jan 2018 00 | 10 Jan 2018 | In Development |
| 10 Jan 2018 00 | 13 Jan 2018 | Laboratory Testing |
| 13 Jan 2018 00 | 15 Jan 2018 | In Development |
| 15 Jan 2018 00 | 18 Jan 2018 | Battlefield Testing |
Chart LINE
X: DAY([Start Date])
Y: RUNNING_SUM(COUNT([Row Number]))
Annotation: VELOCITY_FORECAST(LAST([RUNNING_SUM(Count of Records)]), LAST([RUNNING_SUM(Count of Records)]) + 5, 1)#### Annotation: LAST([RUNNING_SUM(Count of Records)]) + 5
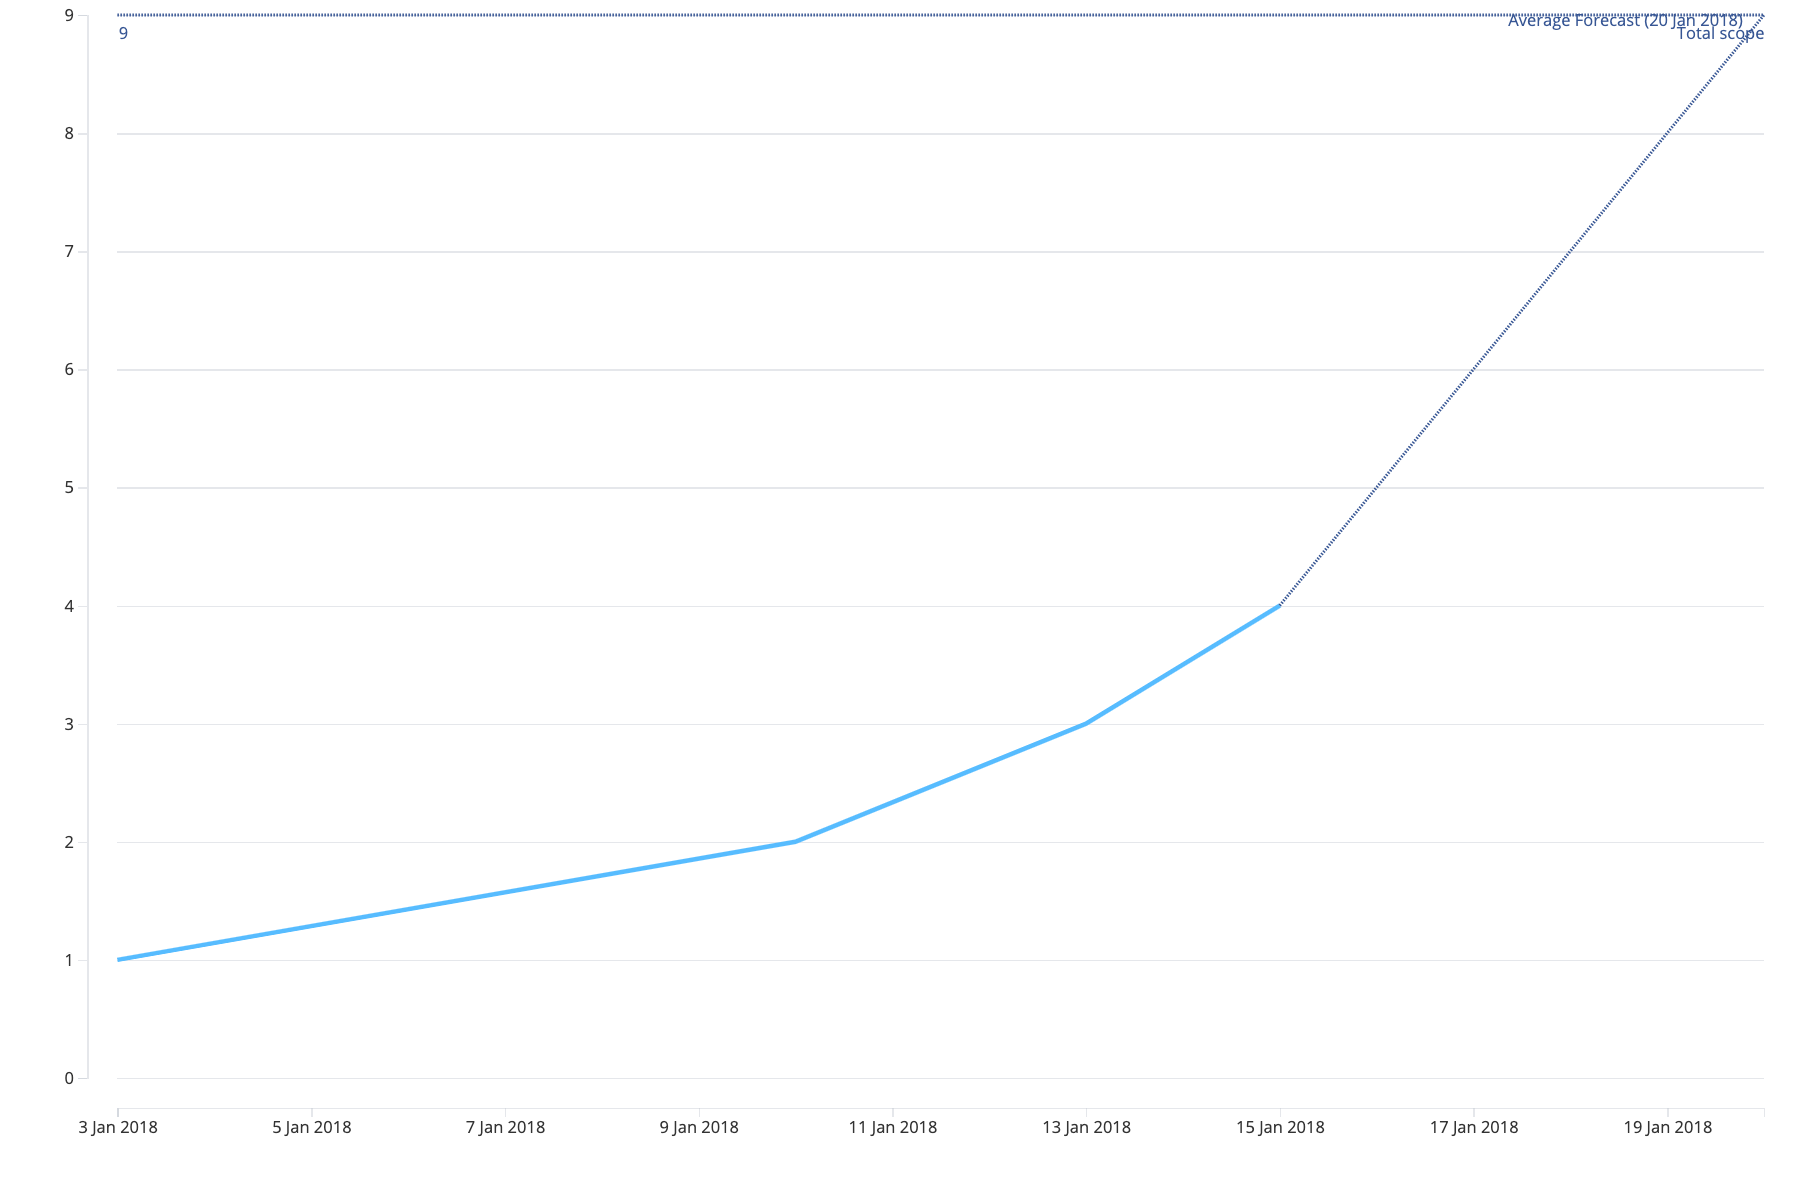
| DAY(Start Date) | RUNNING_SUM(Count of Records) |
|---|---|
| 3 Jan 2018 | 1 |
| 10 Jan 2018 | 2 |
| 13 Jan 2018 | 3 |
| 15 Jan 2018 | 4 |