IDEAL_LINE
IDEAL_LINE(0, LAST([Count Of Records]))Syntax
IDEAL_LINE(start, end)
Shows the line by defined start and end points.
start: Any numerical constant or aggregation created against numerical chart dimension used for the chart.
end: Any numerical constant or aggregation created against numerical chart dimension used for the chart.
Use cases
Ideal Line
Shows the line from zero to total count of records.
Source: History
History records related to production flow of implementing super hero protective suite feature
| Start Date | End Date | Status |
|---|---|---|
| 03 Jan 2018 00 | 10 Jan 2018 | In Development |
| 10 Jan 2018 00 | 13 Jan 2018 | Laboratory Testing |
| 13 Jan 2018 00 | 15 Jan 2018 | In Development |
| 15 Jan 2018 00 | 18 Jan 2018 | Battlefield Testing |
Chart BAR
X: DAY([Start Date])
Y: RUNNING_SUM(COUNT([Row Number]))
Annotation: IDEAL_LINE(0, LAST([RUNNING_SUM(Count of Records)]))
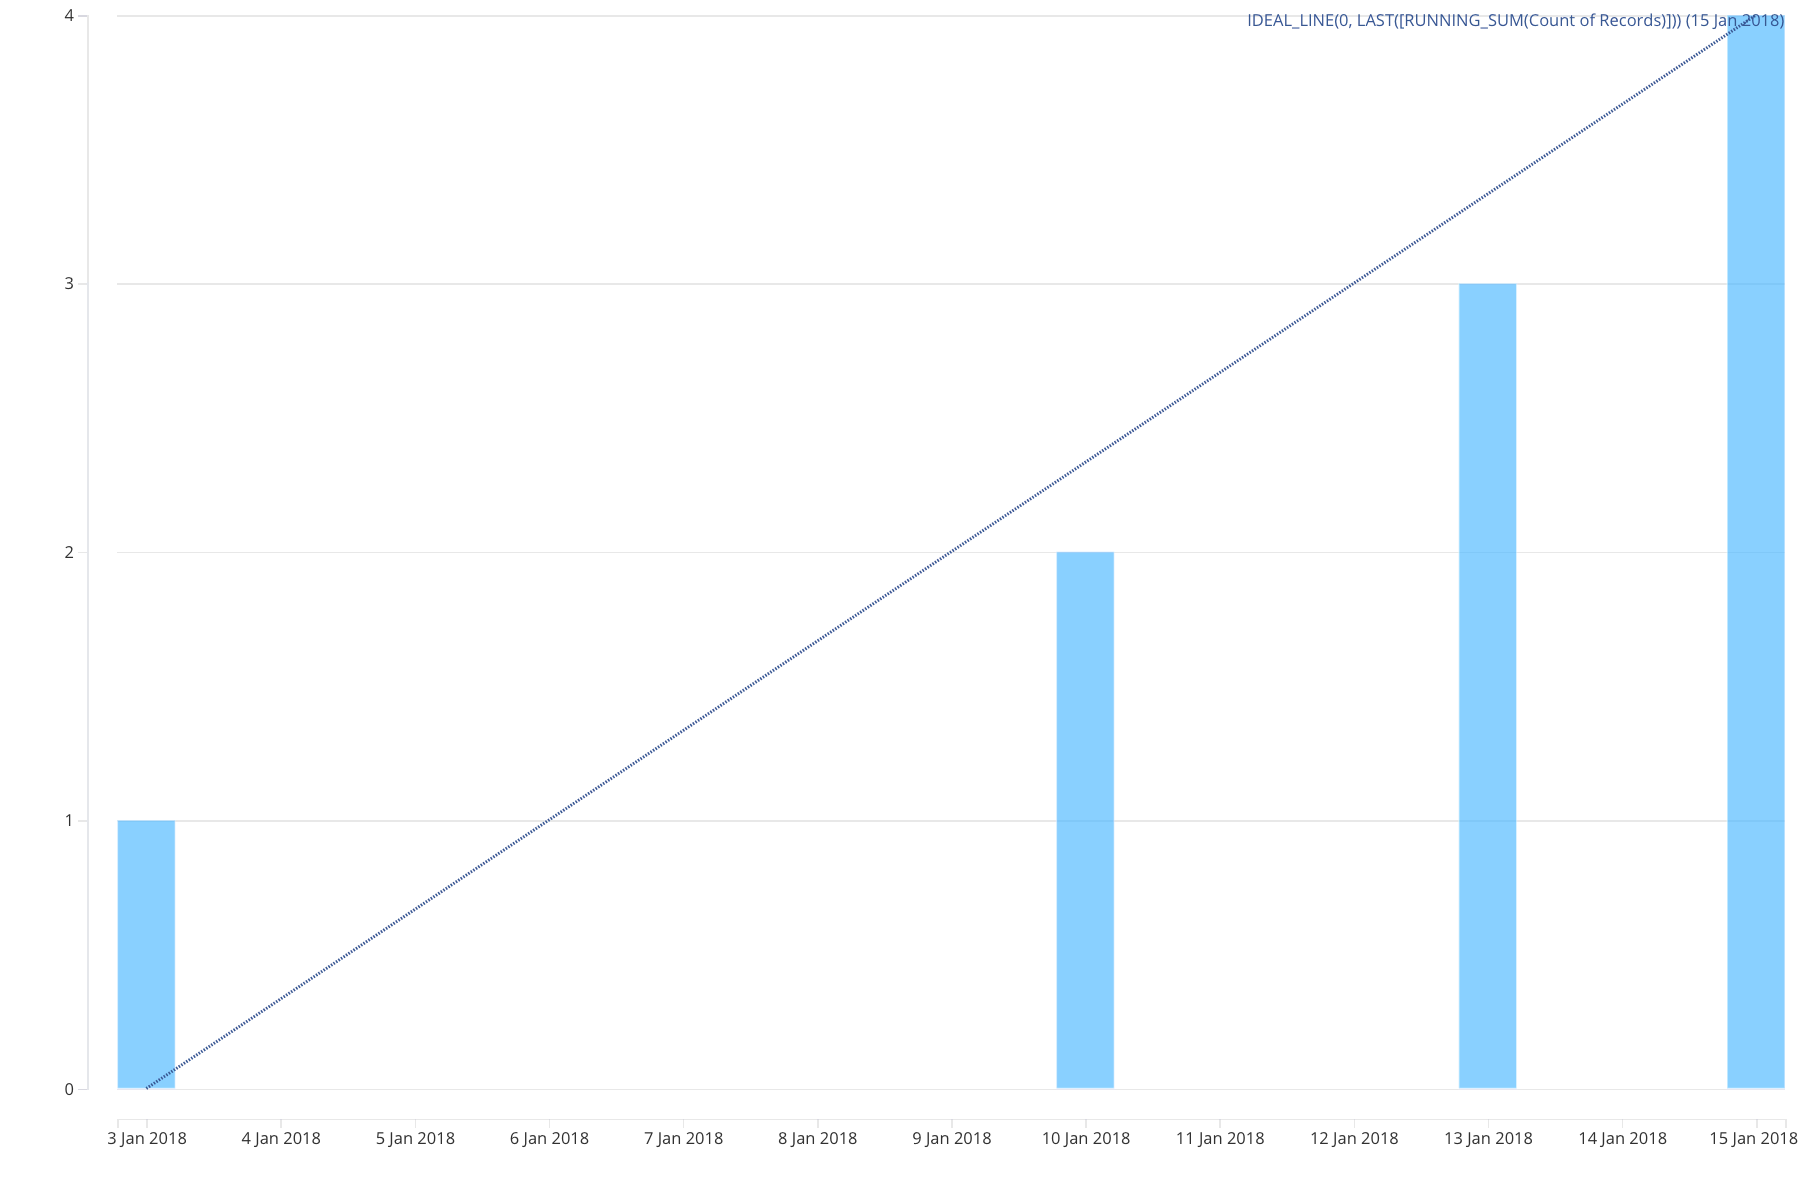
| DAY(Start Date) | RUNNING_SUM(Count of Records) |
|---|---|
| 3 Jan 2018 | 1 |
| 10 Jan 2018 | 2 |
| 13 Jan 2018 | 3 |
| 15 Jan 2018 | 4 |